A closer look at Processes and Resource Utilization
Here we will look at the relationship between process, the kernel and the system resources. The tools we will be discussing can be thought of as performance-monitoring tools.
Tracking processes
We are familiar with ps command. It gives us a snapshot of the process currently running. ps reads data from /proc file system (a virtual file system the kernel exposes).
1
2
3
4
5
6
7
8
9
$ ps aux
# a= all users
# u= user-oriented format
# x= without TTY, includes proceses not attached to a terminal

# Output
USER         PID %CPU %MEM    VSZ   RSS TTY      STAT START   TIME COMMAND
root           1  0.0  0.0  22280 12428 ?        Ss   15:04   0:01 /sbin/init
root           2  0.0  0.0   3072  1760 ?        Sl   15:04   0:00 /init
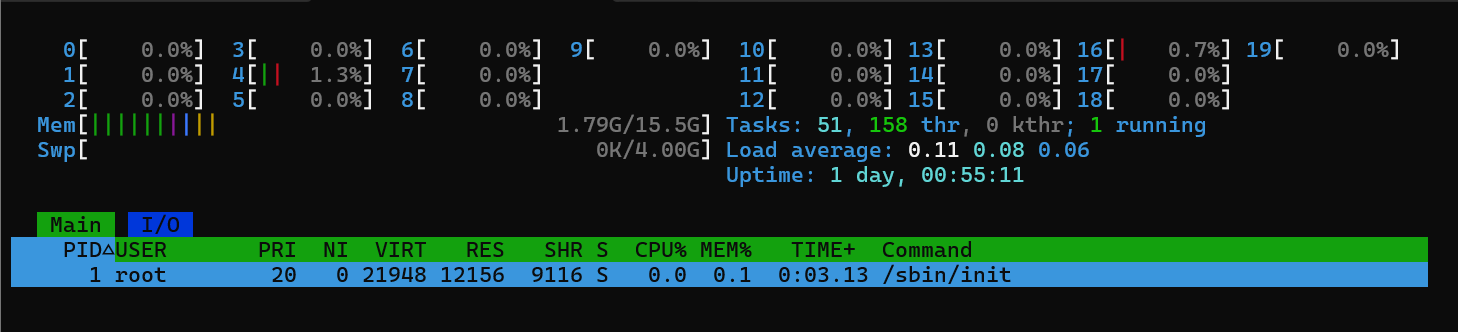
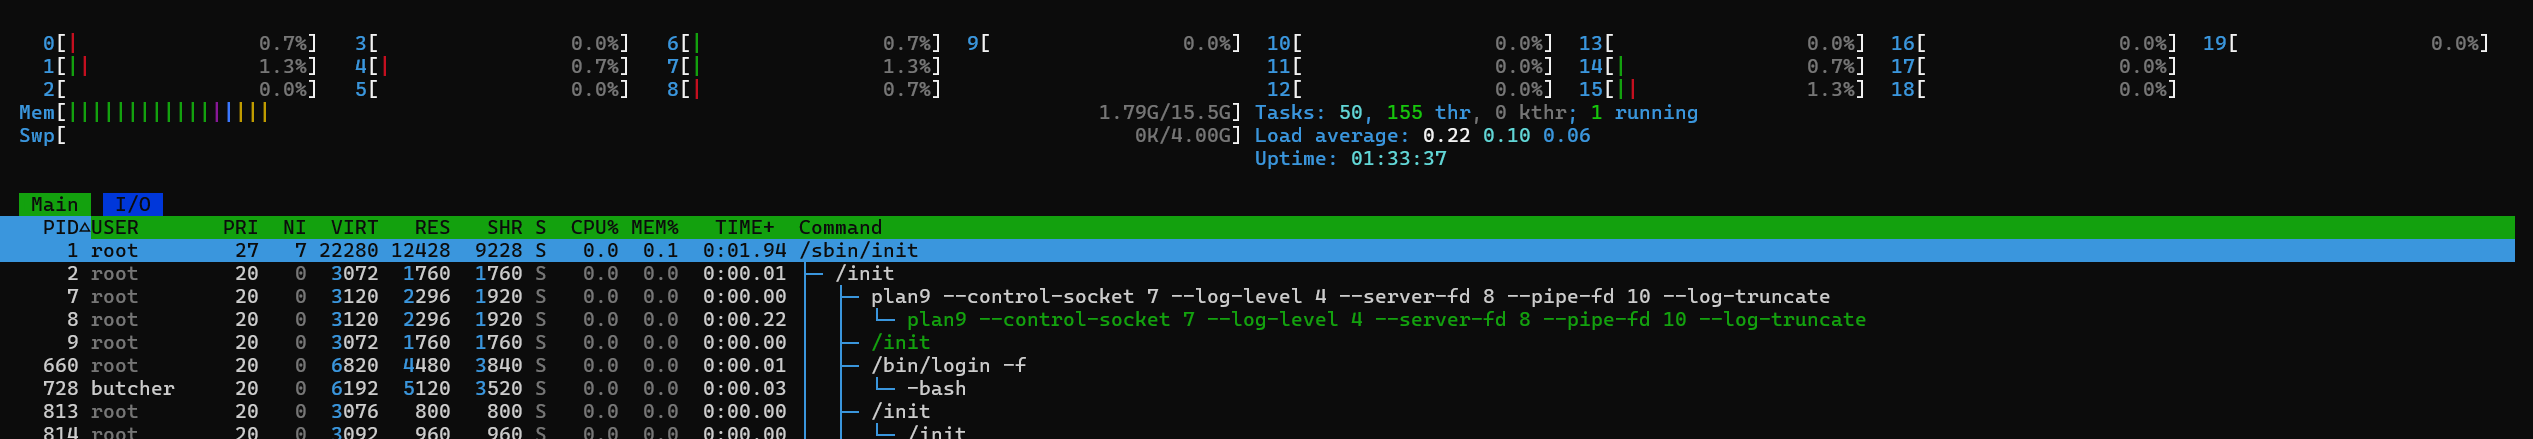
top is an interactive viewer that refreshes every second and highlights the busiest processes at the top. There are two enhanced variants of top. atop and htop.
htop
Header (Top Section)
- CPU bars (one per core):
- Green = user processes
- Red = kernel
- Blue = low-priority
- Gray = I/O wait
- (High usage or lots of gray = problem)
- Mem bar: Green = apps, Blue = buffers, Yellow = cache (normal to look “full”)
- Swap bar: Red = swap in use → bad if growing (memory pressure)
- Right side: Tasks, Load average (1/5/15 min), Uptime
- CPU bars (one per core):
Process List (Main Area)
- PID • USER • %CPU • %MEM • VIRT/RES/SHR (memory) • S (state: R=running, S=sleeping, etc.) • TIME+ (CPU time) • Command
lsof - list open files
It shows which processes have which files open- and vice versa.
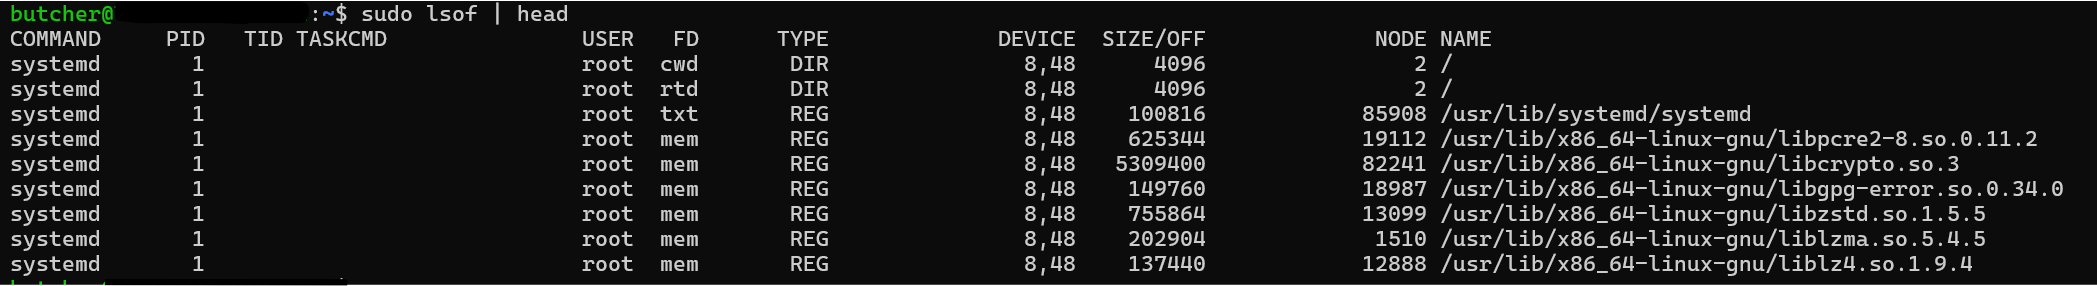
Breakdown
- COMMAND — Name of the command/process (truncated to 9 characters sometimes).
- PID — Process ID (links back to what you saw in ps or htop).
- USER — Owner of the process.
- FD — File Descriptor (how the process refers to the file internally):
- cwd = current working directory
- rtd = root directory
- txt = the executable itself
- Numbers like 0, 1, 2 = standard input/output/error
- 3u, 4r, 5w = file descriptor number + mode (r=read, w=write, u=read/write)
- TYPE — Type of “file”:
- REG = regular file
- DIR = directory
- CHR = character device (e.g., terminal)
- BLK = block device (e.g., disk)
- FIFO = pipe
- SOCK = socket (network or Unix domain)
- DEVICE — Device numbers (major,minor) or “memory” for some cases.
- SIZE/OFF — Size of the file or current offset (position) in the file.
- NODE — Inode number (unique identifier inside the filesystem) or protocol info for sockets.
- NAME — Full path to the file, or socket details (e.g., TCP 192.168.1.10:22->203.0.113.5:12345).
Useful Commands
1
2
3
4
5
6
7
8
9
10
11
12
13
14
15
16
17
18
19
20
21
22
23
24
25
26
27
28
29
# Files opened by a specific process

sudo lsof -p 1234          # by PID
sudo lsof -c sshd          # by command name (all sshd processes)

# Which process is using a specific file or directory

sudo lsof /home/user/myfile.txt
sudo lsof /mnt/usbdrive     # why can't I unmount?

# Open files for a specific user

sudo lsof -u username
sudo lsof -u ^root         # exclude root (note the ^)

# Network connections and ports

sudo lsof -i               # all internet sockets
sudo lsof -iTCP -i :22     # who is using SSH port 22?
sudo lsof -i :80           # processes listening on or connected to port 80
sudo lsof -iUDP            # UDP only

# Only show PIDs (useful for scripting, e.g., killing)

sudo lsof -t -u username          # just the PIDs
sudo lsof -t /path/to/file

# Combine filters (AND logic with -a)
sudo lsof -a -u username -i :443   # username AND port 443
Tracing program execution and system calls
strace traces system calls (the interface between a program and the Linux kernel). It shows exactly what a process is asking the kernel to do (open files, read/write, network, memory allocation, etc.
ltrace (library trace) intercepts and displays library function calls (dynamic/shared library calls) made by a program.
Most programs do not make system calls directly. They call library functions (from libc.so, libssl.so, etc.), and those libraries then make the actual system calls. ltrace gives you the “user-space” view, while strace gives the “kernel boundary” view.
Basic Command
1
2
3
4
5
6
7
strace <command>               # trace a new command
sudo strace -p <PID>           # attach to a running process (Ctrl+C to detach)
strace -o trace.log <command>  # save output to file

ltrace <command>                 # Trace a new command
sudo ltrace -p <PID>             # Attach to a running process (Ctrl+C to stop)
ltrace -o trace.log <command>    # Save output to a file
Threads
- Process = Full program with its own memory, files, PID.
- Thread = Lightweight “sub-process” inside a process.
- Threads share the same memory, open files, and resources → faster and more efficient for concurrency.
- Linux treats threads as processes that share resources (1:1 threading model).
How to See Threads
1
2
3
4
5
$ htop # Press H to toggle threads on/off (easiest)
$ ps -eLf or ps -o pid,tid,comm # Shows threads (same PID, different TID).
$ top # Press H to show threads.
$ /proc/<PID>/task/ # Each subdirectory = one thread.
$ pstree -p -t <PID> # Tree view with threads.
Tracing Threads
- Use strace -f and ltrace -f (the -f flag follows threads).
- Common creation syscall: clone().
Resource Monitoring
Use uptime for quick system health, pidstat / top for detailed CPU time, and nice/renice to control which processes get more (or less) CPU.
Memory Monitoring
Linux uses virtual memory — every process thinks it has its own large, continuous block of memory, but the kernel maps this to physical RAM using the Memory Management Unit (MMU) and pages (usually 4KB chunks).
- The kernel is aggressive about using all available RAM for caching and buffering to improve performance.
- When processes need more memory, the kernel reclaims cache/buffers quickly.
- If physical RAM runs low, the kernel starts swapping (moving less-used pages to disk/swap space) — this slows the system dramatically.
Tools
1
2
3
4
free -h -s 2     # Refresh every 2 seconds (like a simple monitor)
free -h -t       # Show a total line at the bottom
vmstat 1 5       # Update every 1 second, show 5 lines
vmstat 5 -S M    # Every 5 seconds, show in Megabyte
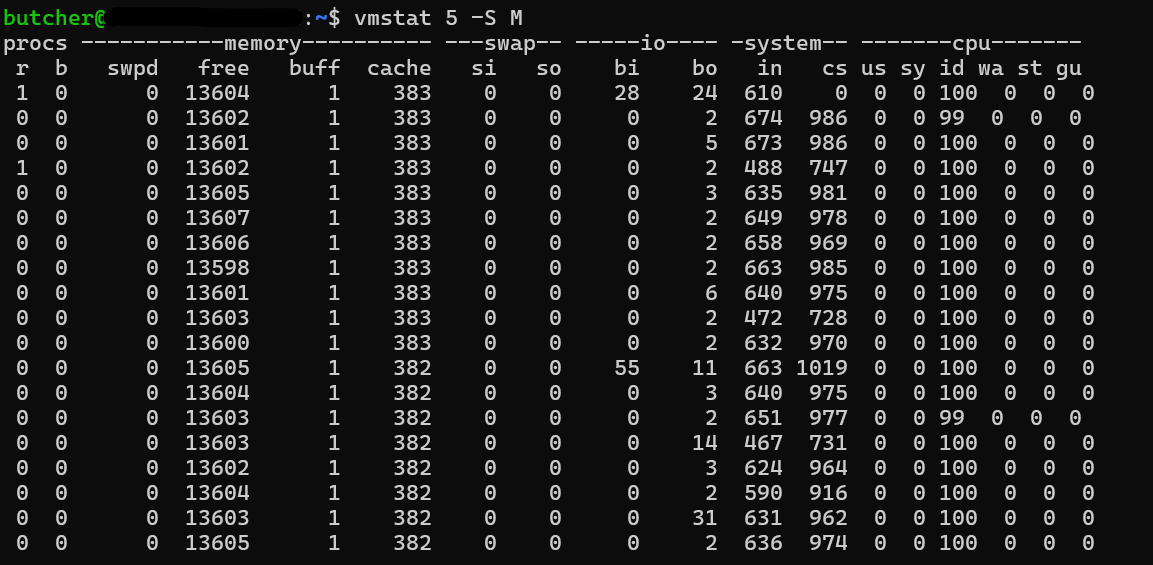
- Used — Memory currently held by processes (including shared libraries).
- Free — Truly unused RAM (rarely high on a healthy system).
- Buffers — Temporary storage for block devices (disk I/O).
- Cache (page cache) — Cached file contents for faster reads/writes.
- Swap — Disk space used as overflow when RAM is exhausted.
- si — Swap in (KB/s) — pages being read from swap into RAM.
- so — Swap out (KB/s) — pages being written to swap.
I/O Monitoring
I/O (Input/Output) refers mainly to disk activity - reading from and writing to storage devices (HDDs, SSDs, NVMe).
iostat
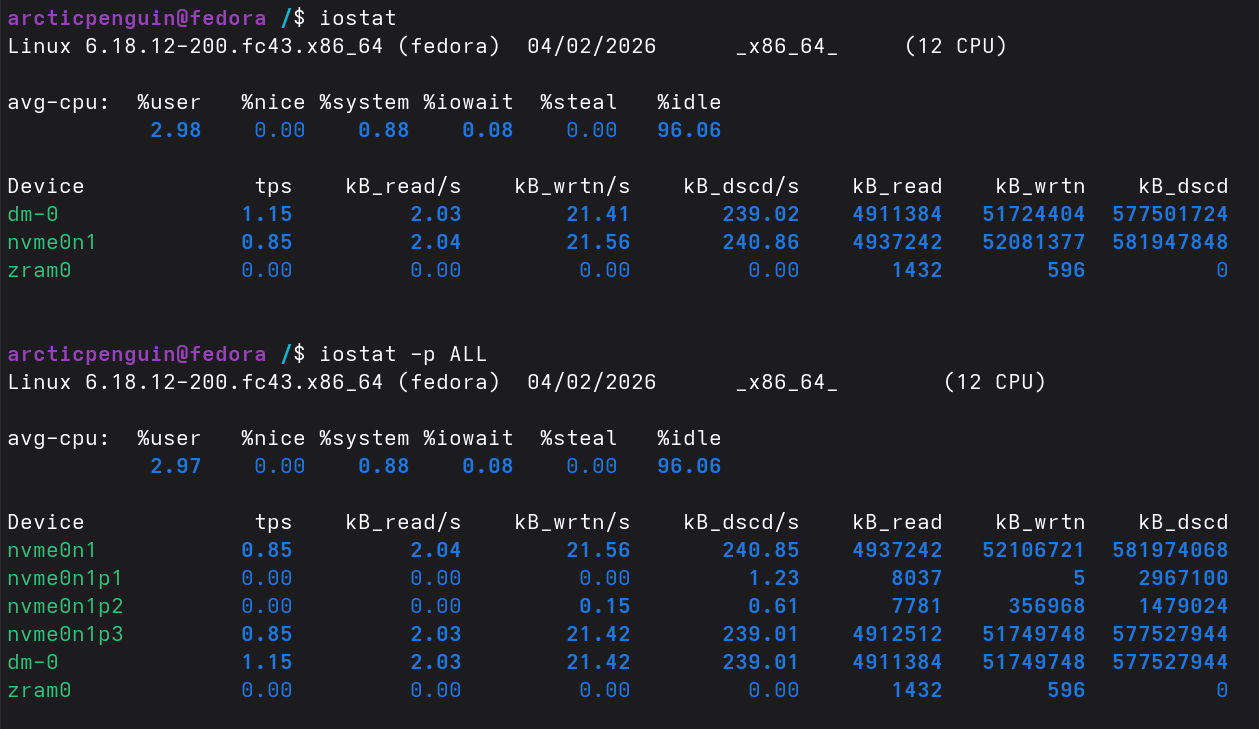
Use cases:
1
2
3
4
5
iostat                  # Snapshot since boot (averages)
iostat -p ALL           # -p shows partition info
iostat 2 5              # Refresh every 2 seconds, 5 times
iostat -x 2             # Extended statistics (most useful)
iostat -d -x 2          # Disk only, extended
Per-Process I/O Utilization and Monitoring: iotop
Shows which processes are reading/writing the most (DISK READ / DISK WRITE columns)
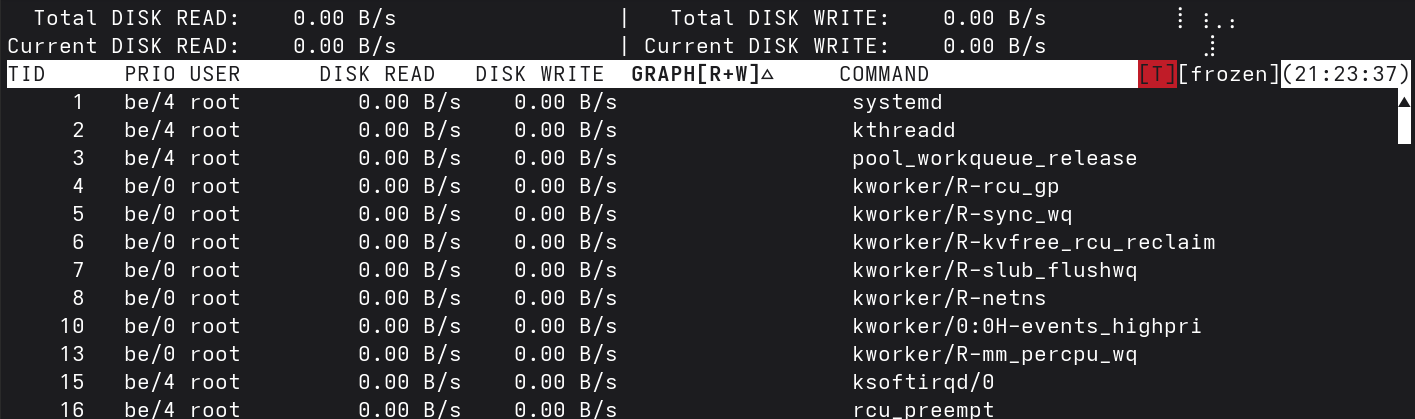
Kernel allows more I/O time for a process with priority be/3 than one with priority be/4
be: Best effort. The kernel does its best to schedule I/O fairly for this classrt: Real time. The kernel schedules any real-time I/O before any other class of I/O, no matter what.idle: Idle. The kernel performs I/O for this class only when there is no other I/O to be done.
Use cases:
1
2
3
4
5
6
7
8
9
10
11
# Basic live view
iostat -x 2

# Disk-only extended stats
iostat -d -x 2 10

# Watch a specific device
iostat -x /dev/nvme0n1 2

# Find the process causing heavy I/O
sudo iotop -o          # -o shows only active processes
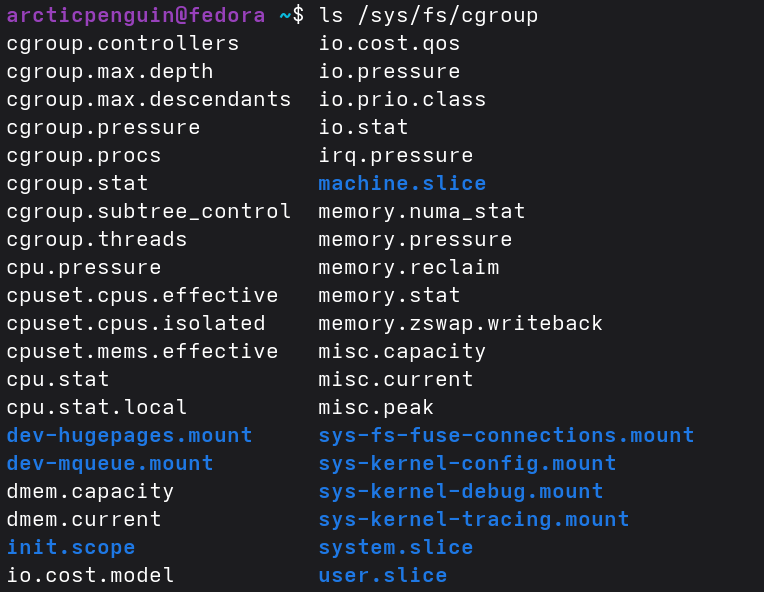
Control Groups
cgroups (control groups) is a Linux kernel feature that lets you organize processes into groups and limit, account for, and prioritize the resources they can use.
Containers (Docker, Podman, Kubernetes, LXC) rely heavily on cgroups for isolation and resource limits.
Useful Commands
1
2
3
systemd-cgls                  # Tree view of all cgroups (easiest)
cat /proc/<PID>/cgroup        # Which cgroup a process belongs to
systemd-run --scope -p MemoryMax=500M <command>   # Quick limit
Now we know how to inspect processes, understand what they’re doing under the hood, and monitor/control CPU, memory, and I/O resources like a superuser. We will move on to the topic of network and its configuration in Linux.